
- Jupyter Notebook
- Tableau
-
Python packages and libraries:
- Numpy
- Pandas
- Matplotlib
- Skilearn
- Statmodels
- Folium

Canada has about 9% of the world’s forests. Each year over the last 25 years, about 7,300 forest fires have occurred. The total area burned varies widely from year to year but averages about 2.5 million hectares annually. Some are uncontrolled wildfires started by lightning or human carelessness. A small number are prescribed fires set by authorized forest managers to mimic natural fire processes that renew and maintain healthy ecosystems Wildland fires is a challenge for forest management with the potential to be at once harmful and beneficial. Forest agencies work to harness the force of natural fire to take advantage of its ecological benefits while at the same time limiting its potential damage and costs. This makes fire control strategies a vital component of forest management and emergency management in Canada.
Analyzing previous wildland fire data among the Canadian provinces and national parks to optimize the fire control strategies.
Wildfires is a project that I built as part of my data immersion course at CareerFoundry to demonstrate my mastery of data analysis. I as a data analyst, helped CFS (Canadian Forest Service) by analyzing fire characteristics so they can prioritize and improve timing, locations, etc.


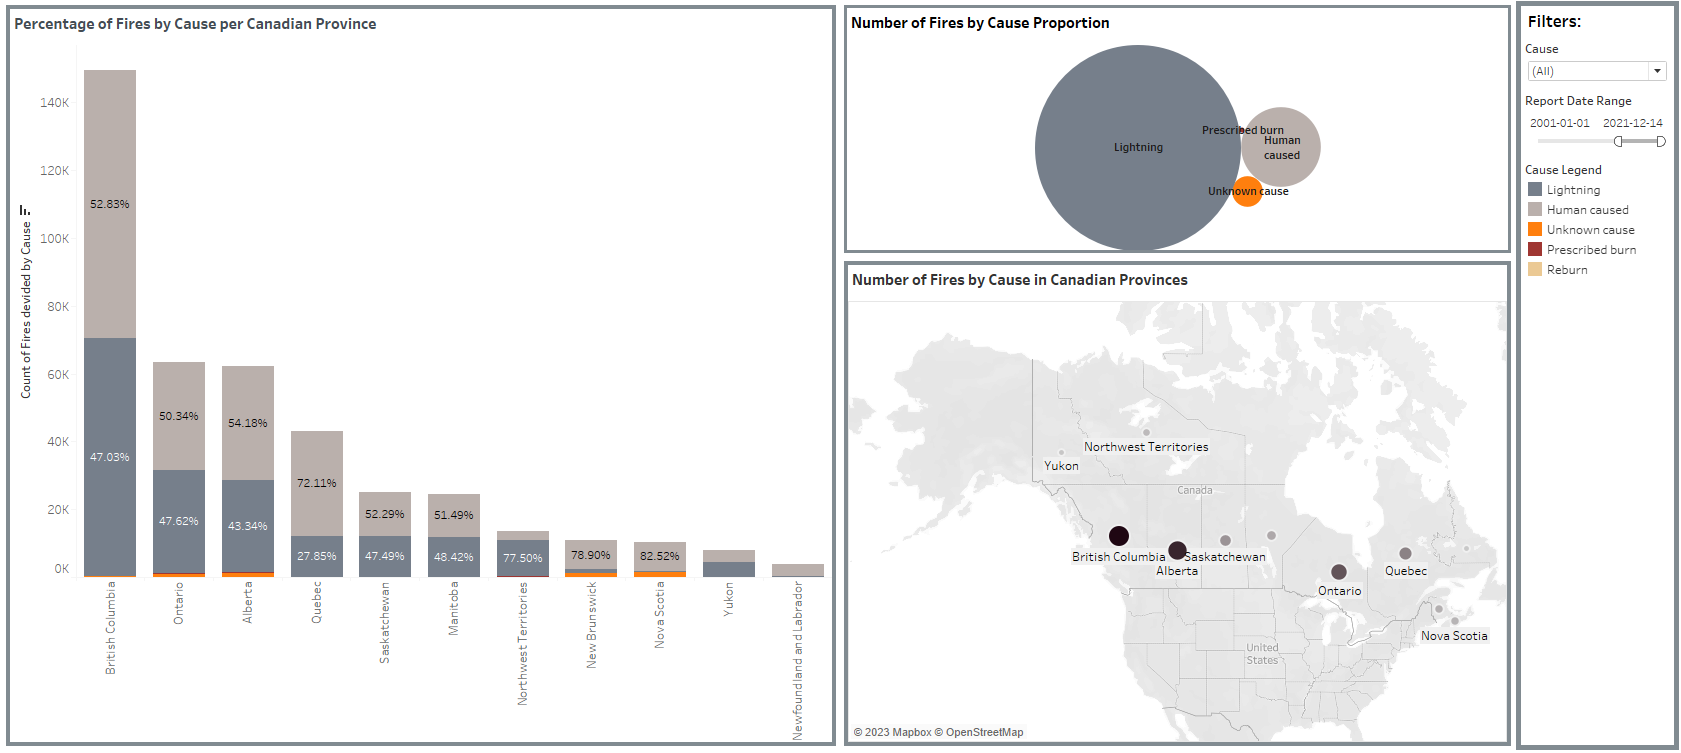
These three questions are solved by analysis of “cause” variable in the dataset.
“Lightening” and “Human-caused” have burned the largest sizes in the past 25 years. We prioritized “human-caused” fires (as a cause which can be controlled) and focused on weather conditions for further analysis.
The top- three provinces with the highest number of fires in the past 25 years are selected for further exploration: British Columbia, Alberta, and Ontario.
Stacked bar chart is used to present the proportion of each cause in each Canadian province.
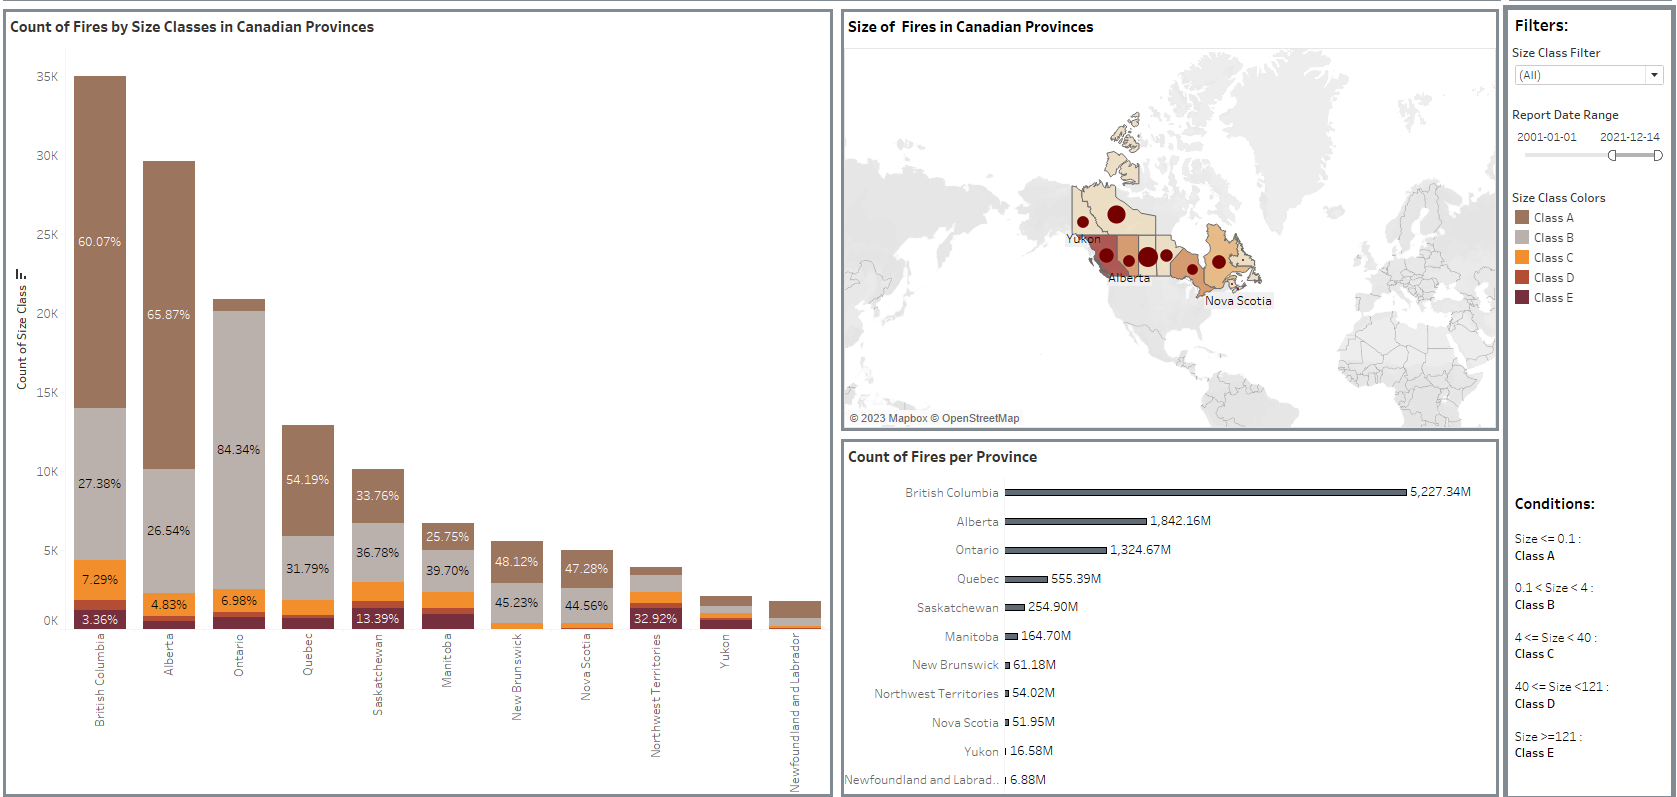
In order to answer this question, we categorized the fires based on “size classes”.
Distribution of fires in Canadian provinces are presented in size classes dashboard.
The stacked bar chart shows that most of the fires in Canadian provinces occurred in small sizes which fall into Class A and Class B.
Northwest Territories have the highest proportion of Class E (largest size) fires with around 32.9% of fires which happened in this area in the past 20 years.
To find an answer to this question we looked for daily weather information for fire locations in Canada. The only open dataset that we were able to find with longitude and latitude was for Alberta, which happens to be among the top three Canadian provinces with the highest number of fires in the past 20 years.
We used the info of the closest weather station to a specific fire in Alberta to map the weather condition around the fire location.
Maximum Wind gust and Maximum temperature are the variables which we selected to conduct the analysis on.
Correlation Matrix was created in Python to determine the relationship between the size of fire and weather characteristics. A weak positive relationship was revealed between the size of fire and the maximum wind gust around the fire location in Alberta.
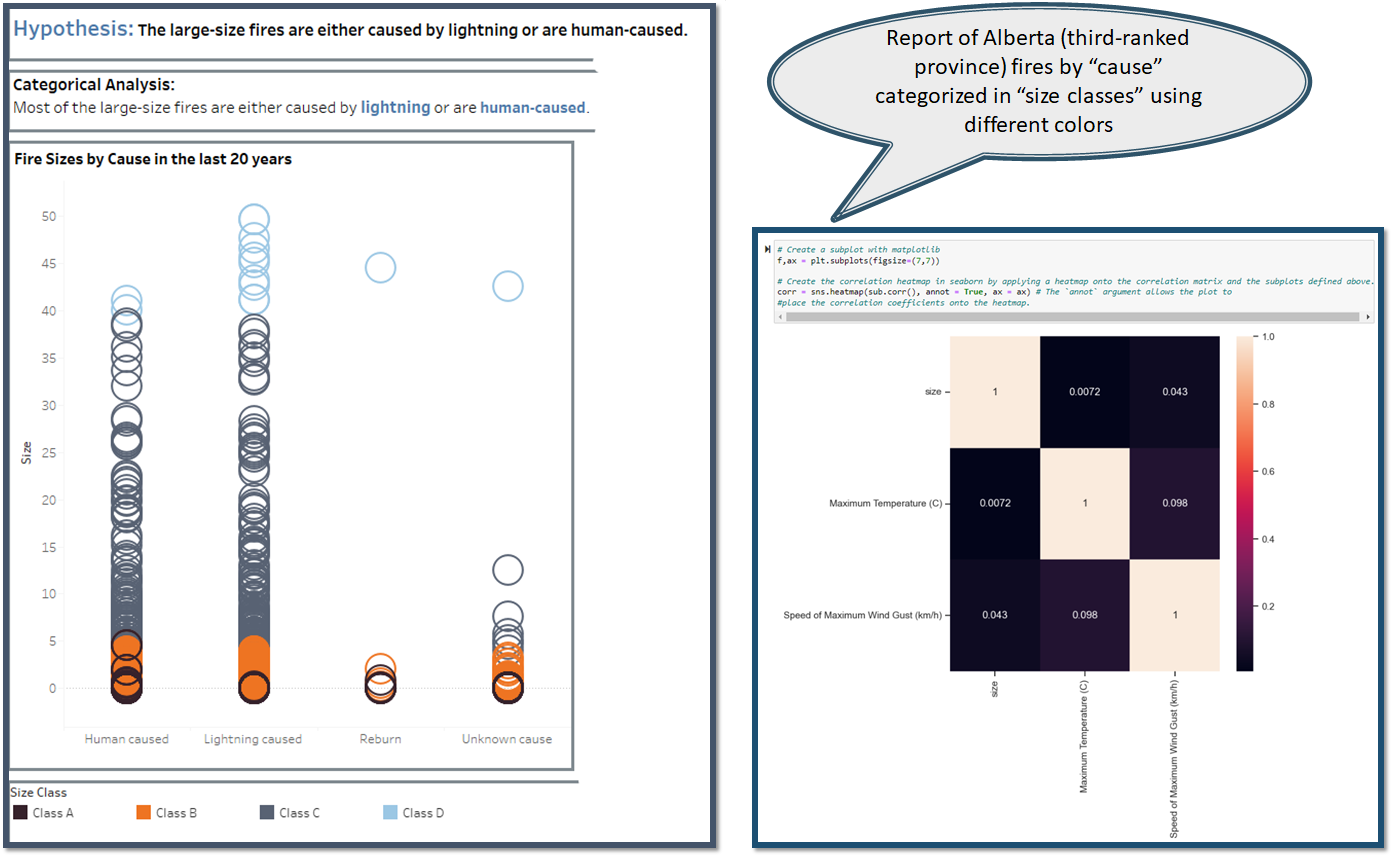
After analyzing and exploring data with regression, we found out there is a weak positive relationship between fire spread and wind gusts in Alberta over the last 20 years.
In the Scatterplot situated underneath, most of the larger fires (light and dark purple dots, which correspond to fire sizes averaging around 88 and 135 hectares, respectively) happen with higher maximum wind gust values. Smaller max wind gust values are associated with smaller fires (light and dark pink dots, corresponding to fire sizes averaging around 1 and 12 hectares, respectively).
This insight can be observed after applying clustering to the data and we were not able to find this relationship using supervised ML (linear regression).

We conducted time-series analysis in Python on historical report of Canadian wildland fires. To forecast the number of fires for upcoming years we applied ARIMA model to estimate the number of human-caused fires in Canada for upcoming years. Note that Tableau uses exponential smoothing to compute the forecasts and present a smoother trend.
The number of human-caused fires in the year of 2023 has been estimated to be 2017 fires around the country.
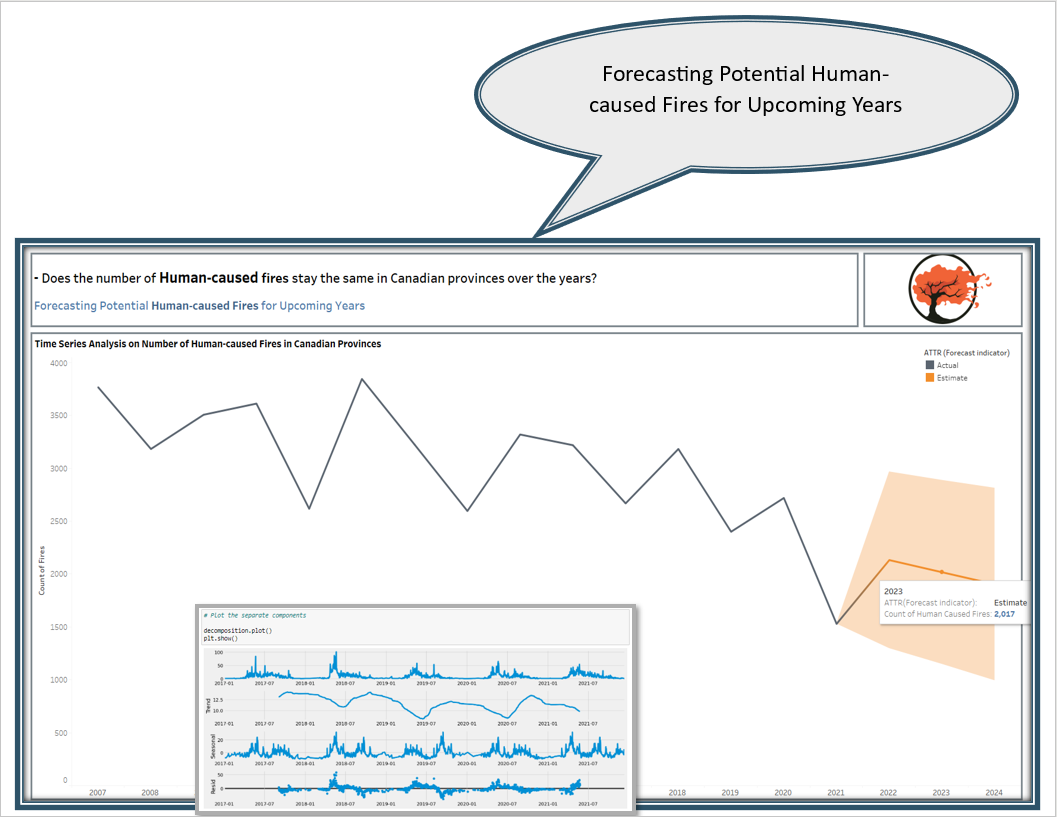

 Tableau Story