
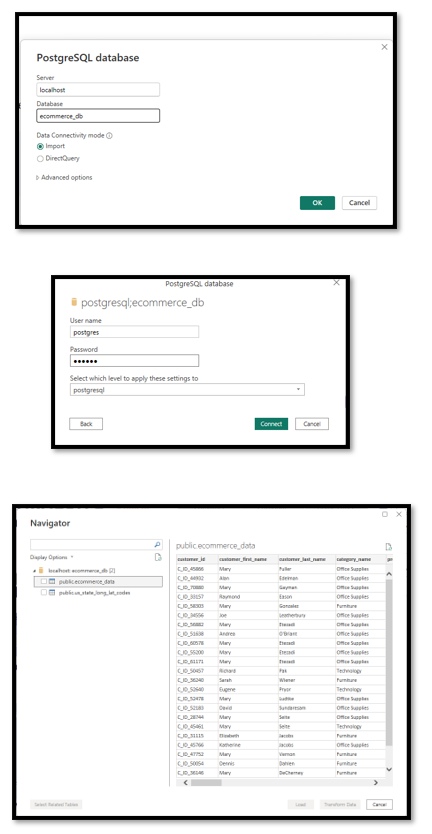
- PostgreSQL
- Microsoft Power BI
- Power Query Editor
- Visual Studio Code
- Excel
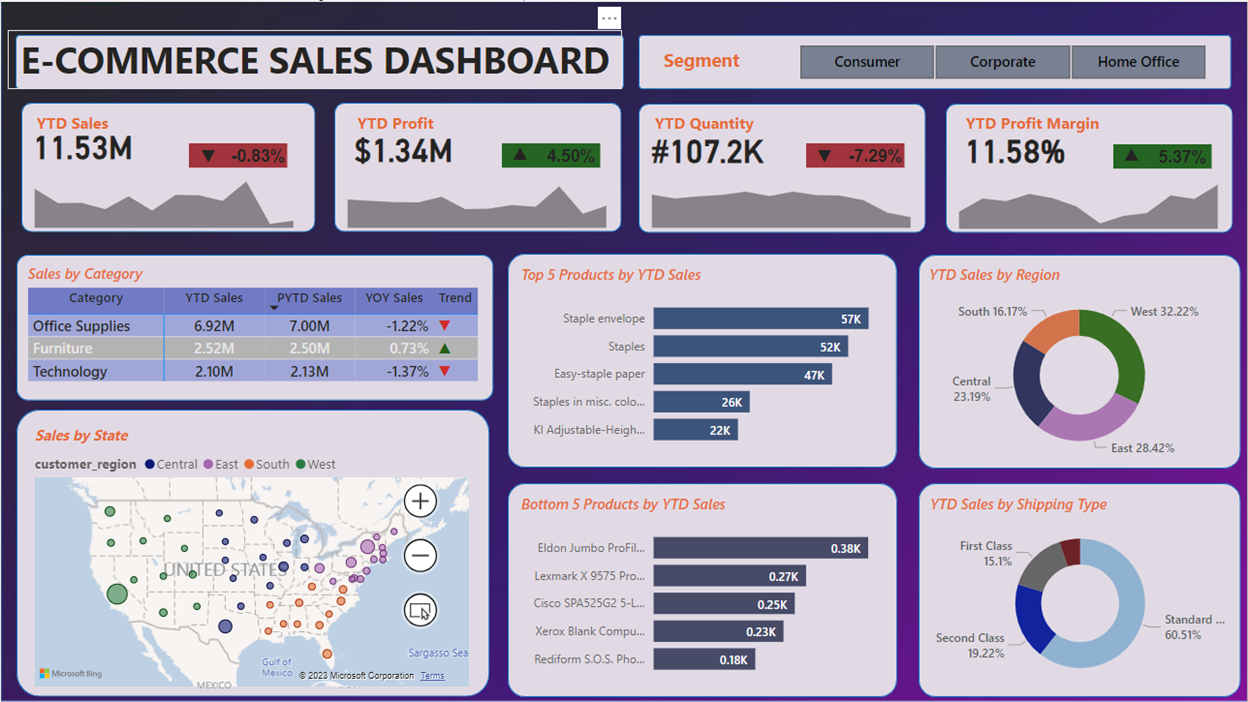
The purpose of this sales report is to show the executives of a fictional e-commerce company the overall results of their marketing and sales activities without the specifics of how sales represantives reached the company's goals.
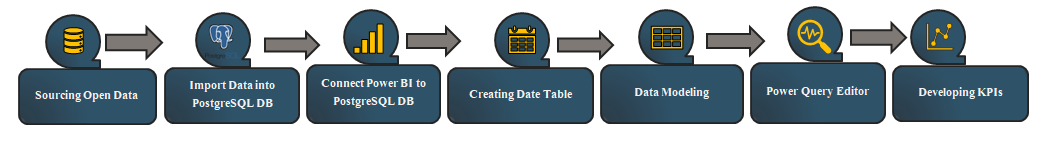
To report on the year-to-date KPIs of the sales in different regions.


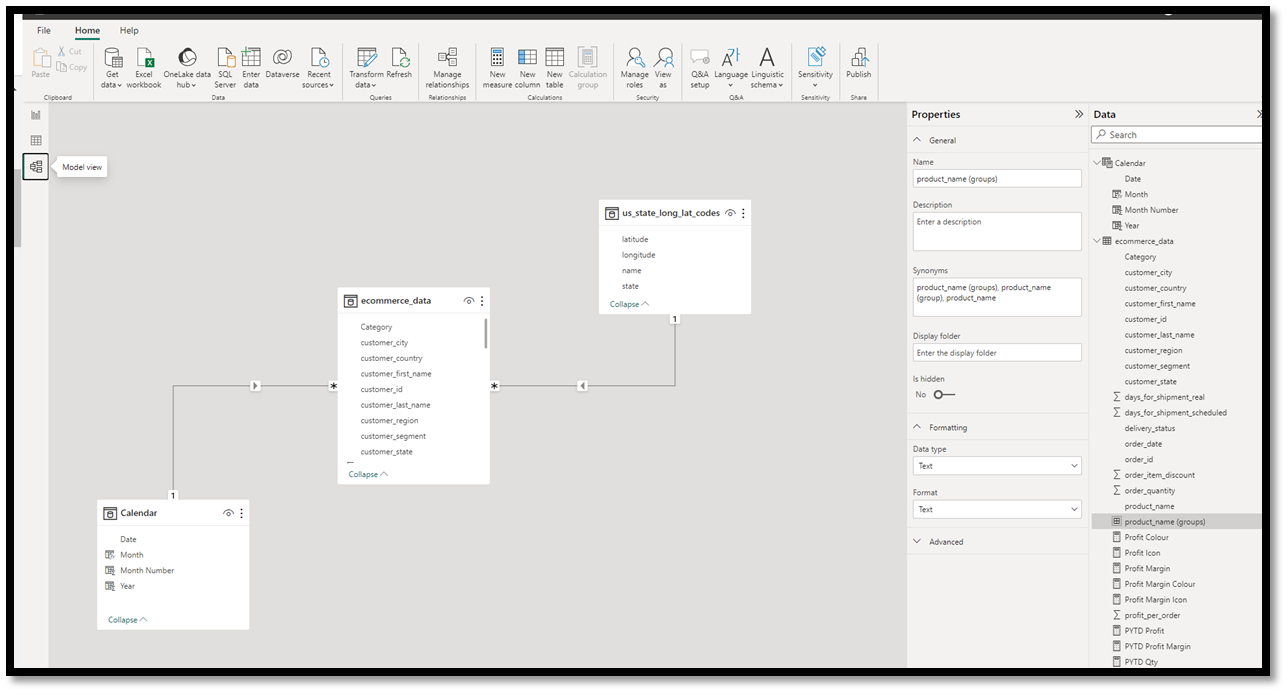
(Based on Star Schema: Fact and dimension tables)

Profit Icon = VAR positive_icon = UNICHAR(9650)
	VAR negative_icon = UNICHAR(9660)
	VAR result = IF([YOY Profit]>0, positive_icon, negative_icon)
return resultPYTD Sales = CALCULATE(Sum(ecommerce_data[sales_per_order]),DATESYTD(SAMEPERIODLASTYEAR('Calendar'[Date])))Based on KPIs, regions, shipping types, etc. Data is using Segment Slicer and is interactive. Please check the link out to work with this interactive sales dashboard in Power BI.
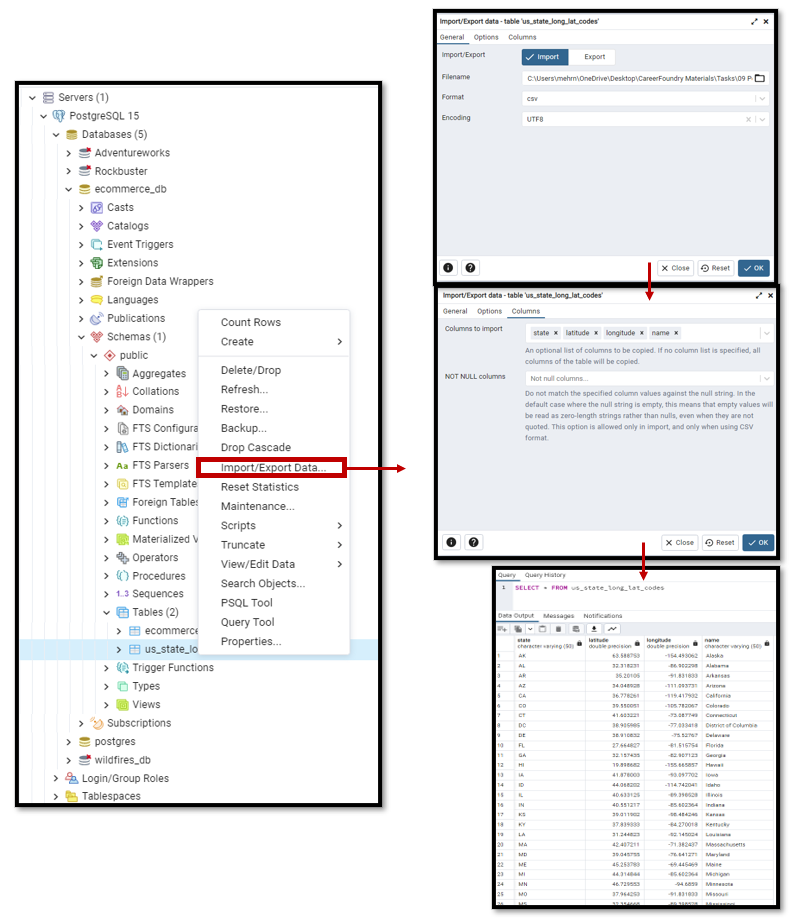
Importing CSV file into PostgreSQL database encountered errors due to unknown encoding of the file. It took us a couple of tries to find the right encoding type. In addition, it is important to find the escape character used in the CSV file and use the same when importing the CSV into the database.