- Jupyter Notebook
-
Python packages and libraries:
- Numpy
- Pandas
- Matplotlib
- Seaborn
Instacart, an online grocery store that operates through an app in North America, already has very good sales, but they want to uncover more information about their sales patterns. They assume they can't target everyone using the same methods, and they’re considering a targeted marketing strategy.
My task is to perform an initial data and exploratory analysis of some of their data in order to derive insights and suggest strategies for better customer segmentation based on the provided criteria.


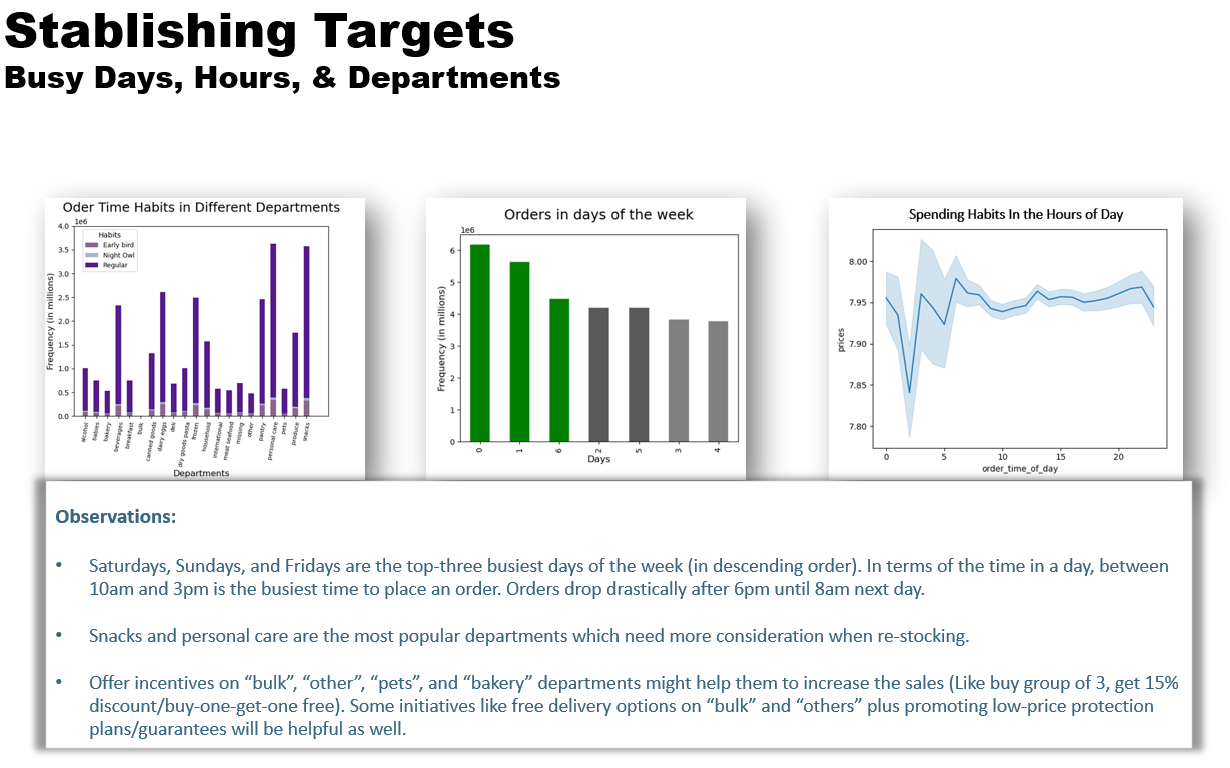
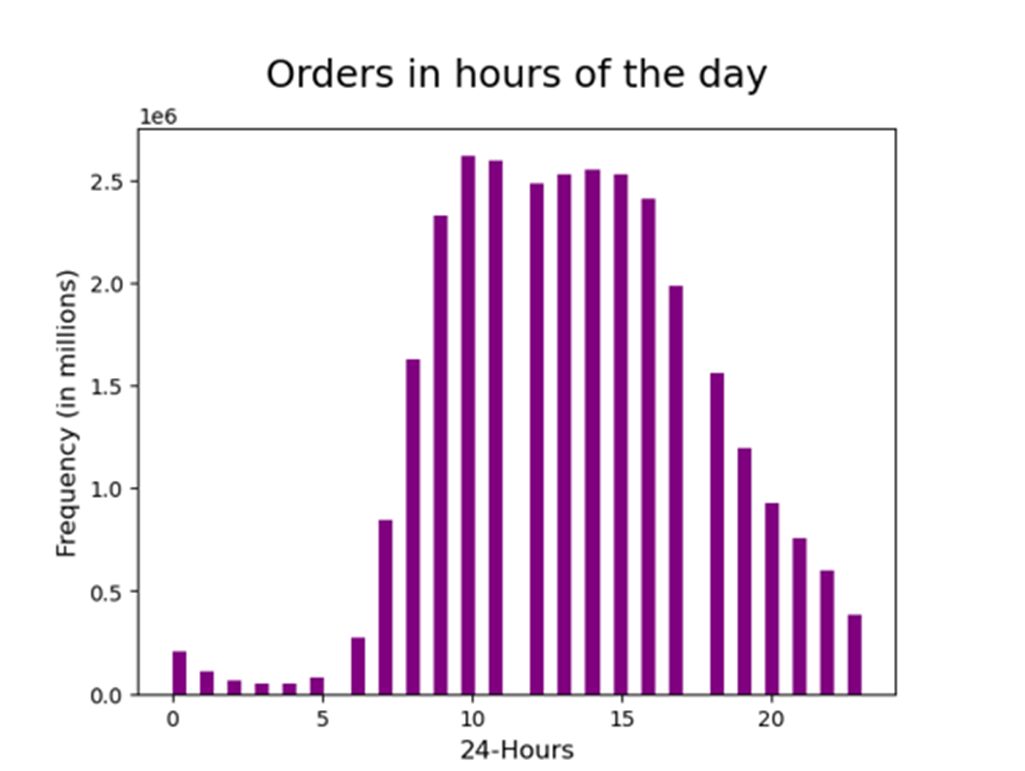
The sales team needs to know what the busiest days of the week and hours of the day are in order to schedule ads at times when there are fewer orders.
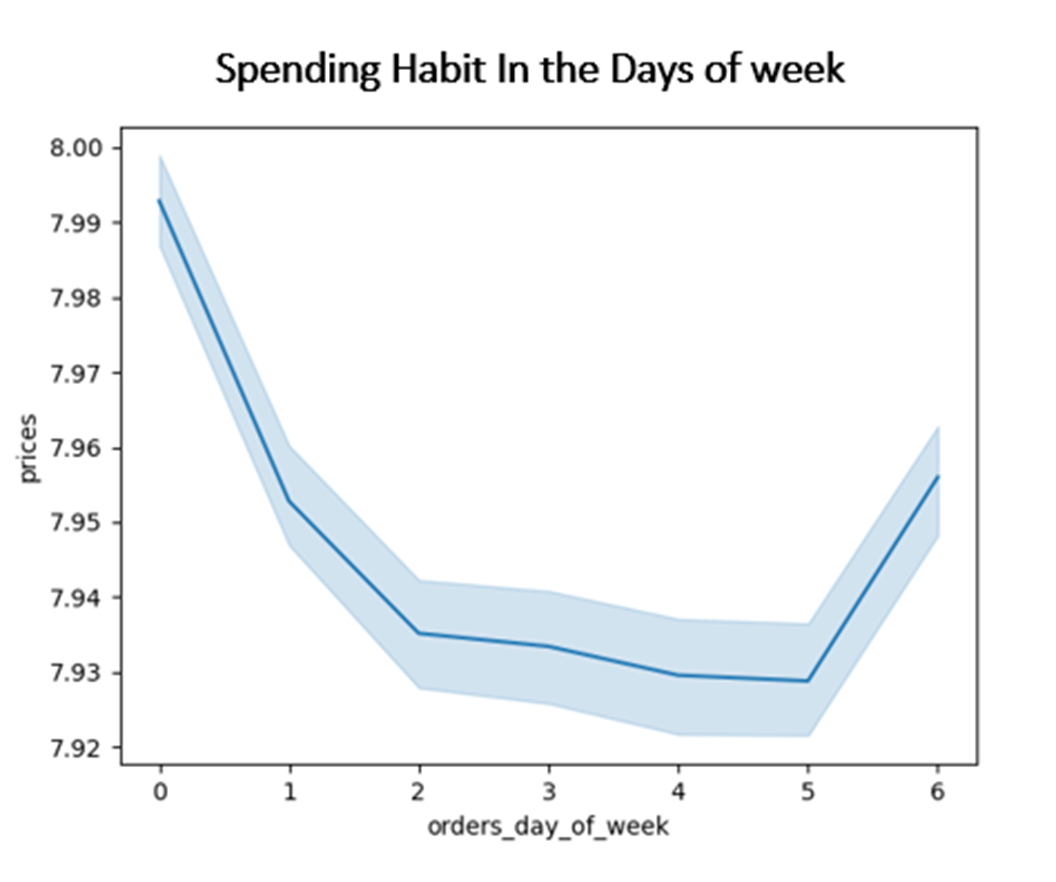
Histograms have been plotted in order to see the distribution of orders over the days of a week/hours of a day. We also draw a line chart to find the customers’ spending habits for a day.
Saturday, Sunday and Friday respectively are the busiest days of the week. In terms of time in a day, between 10am to 3pm is the busiest time to place an order. Orders drop drastically after 6pm until the next day 8am, so weekdays on mentioned hours might be the perfect time to schedule ads.
Please note in the below figures, days are represented in numeric values where 0=Saturday and 6=Friday.
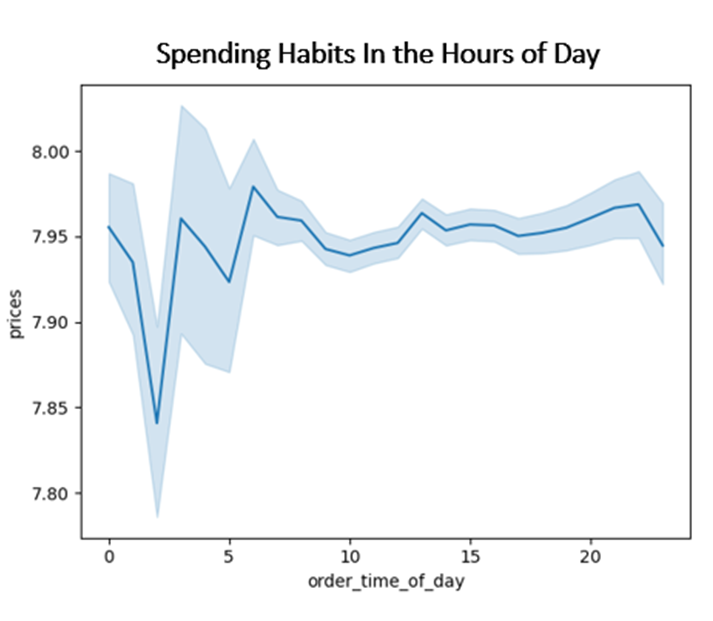
The sales team needs to know whether there are particular times of the day when people spend the most money, as this might inform the type of products they advertise at these times.
High frequency of orders with a low expenditure are placed during the day (9am-5pm). However, a low frequency of orders with a high expenditure happens between 6-8am, early in the morning.
Also, in the afternoon we observed two peaks at noon and around 9 pm. IC can use these hours to inform the type of products they advertise.
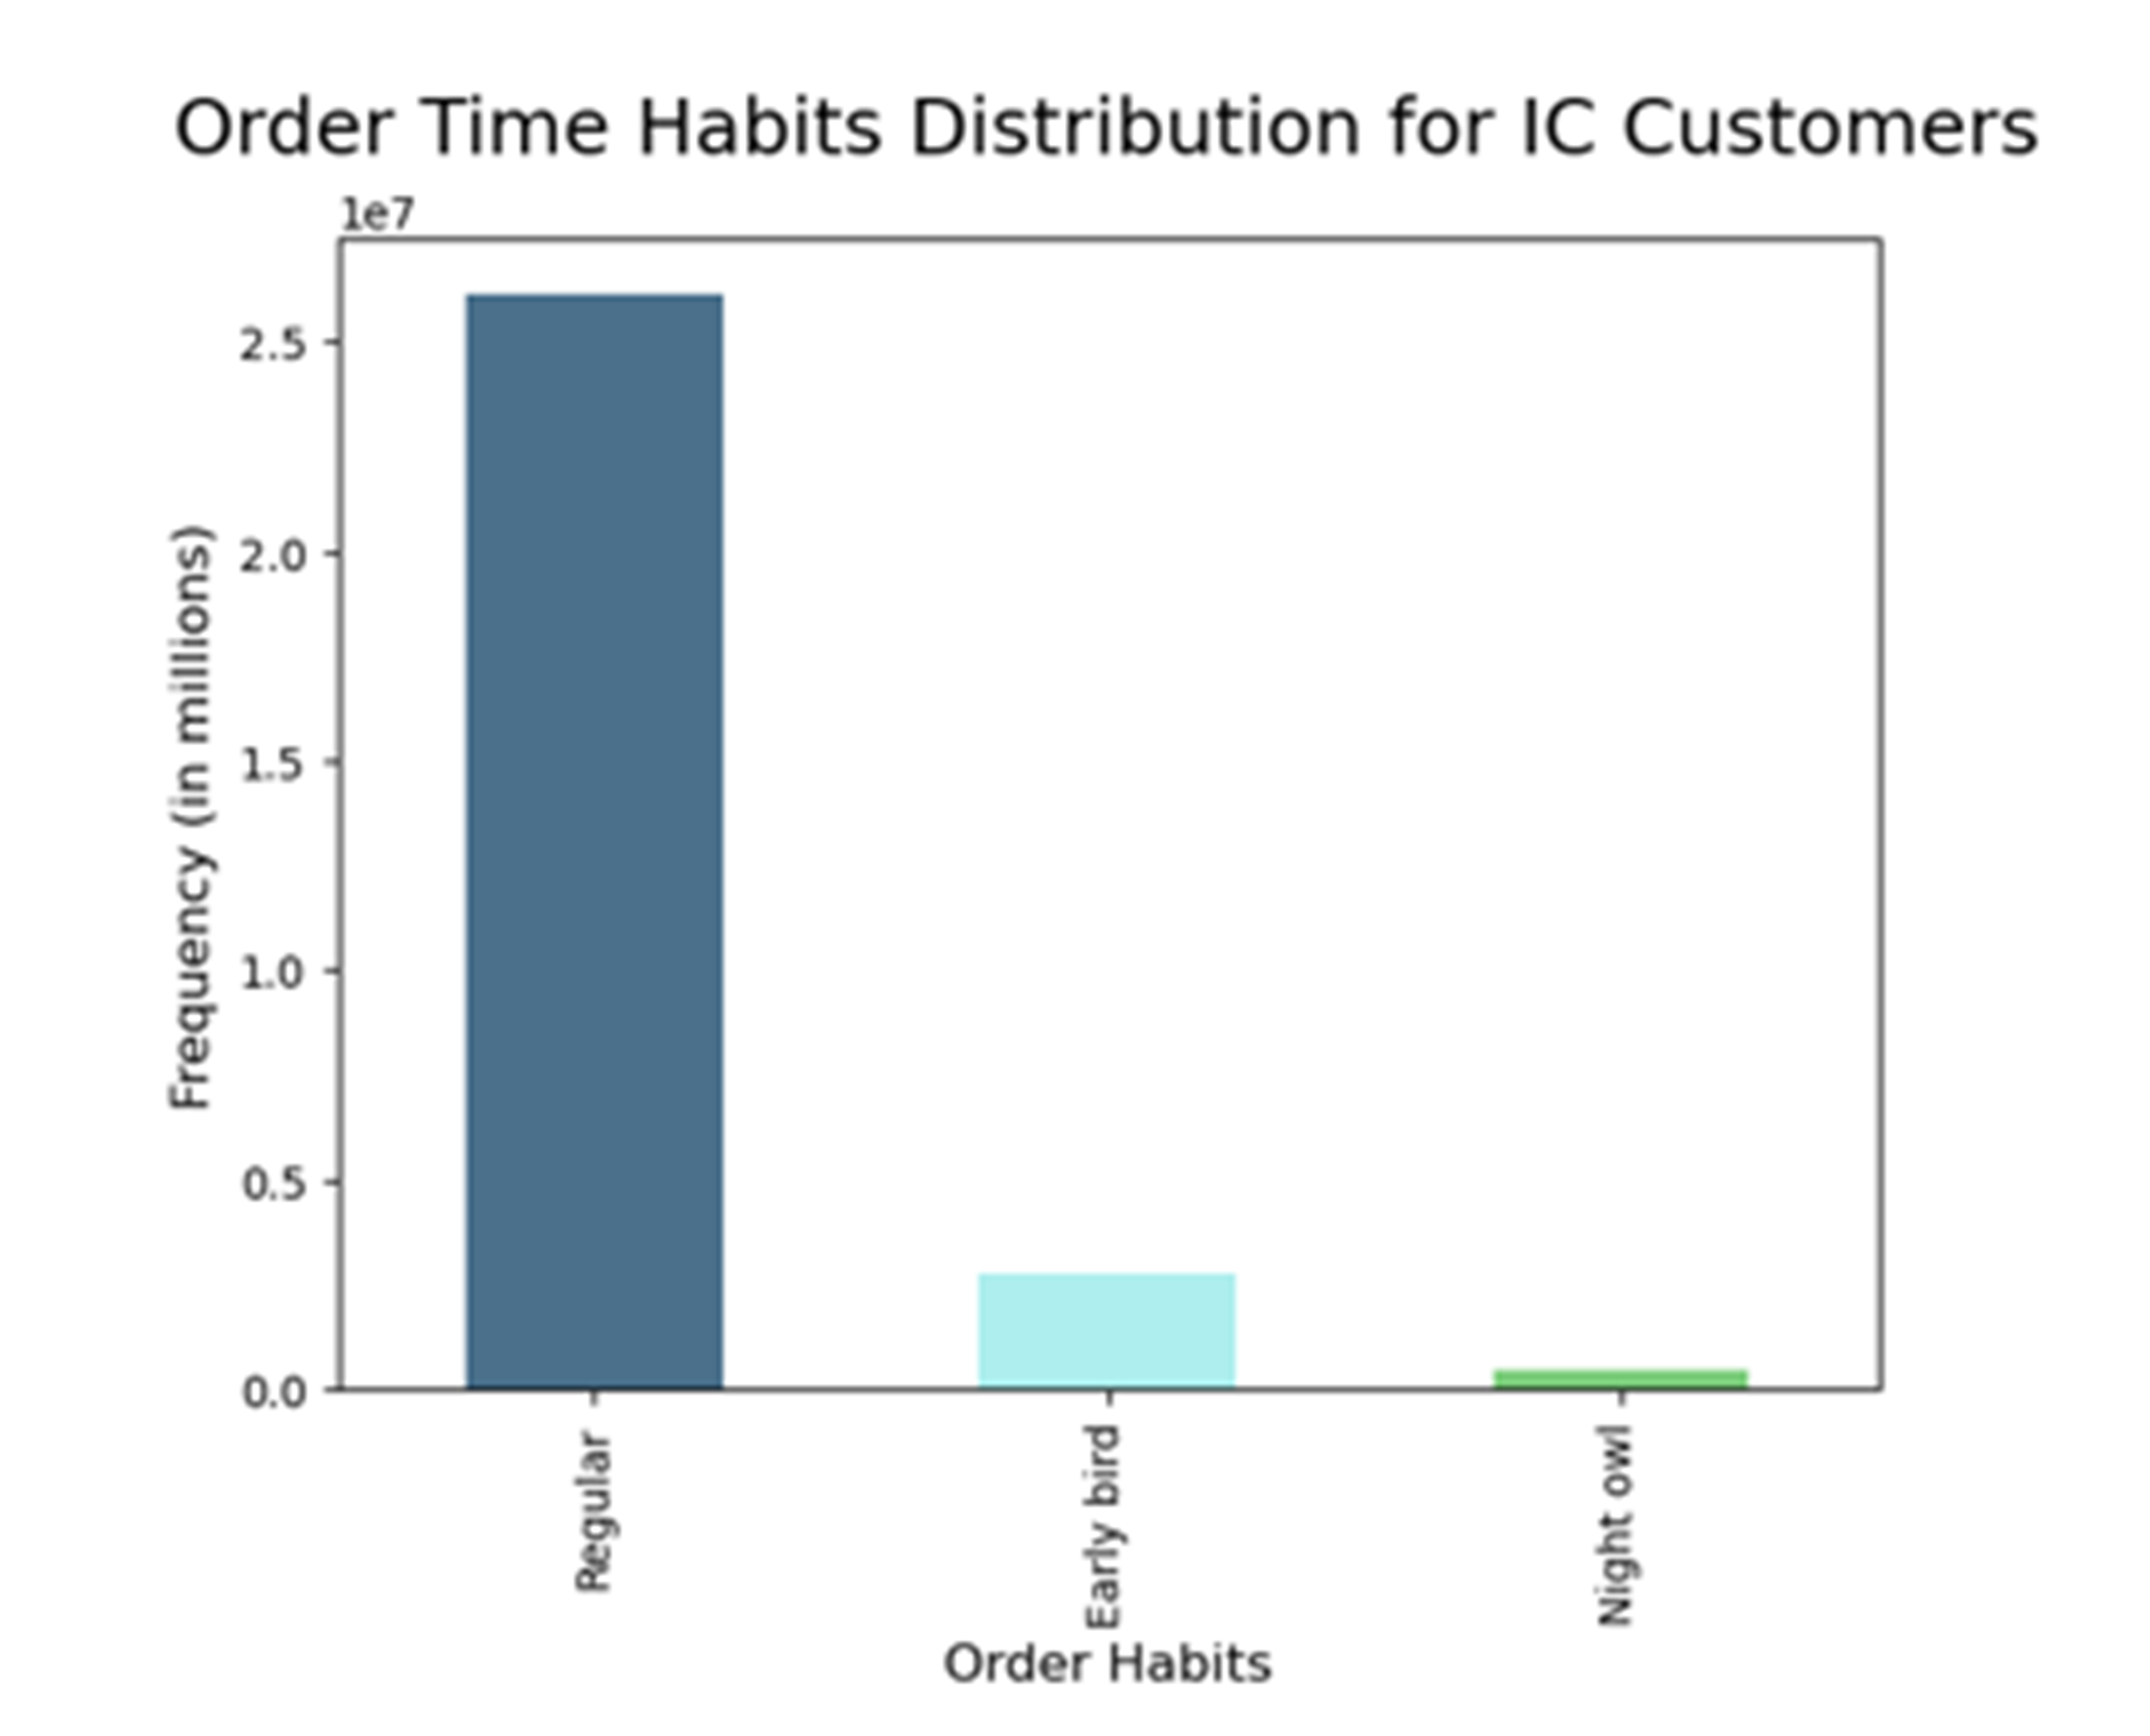
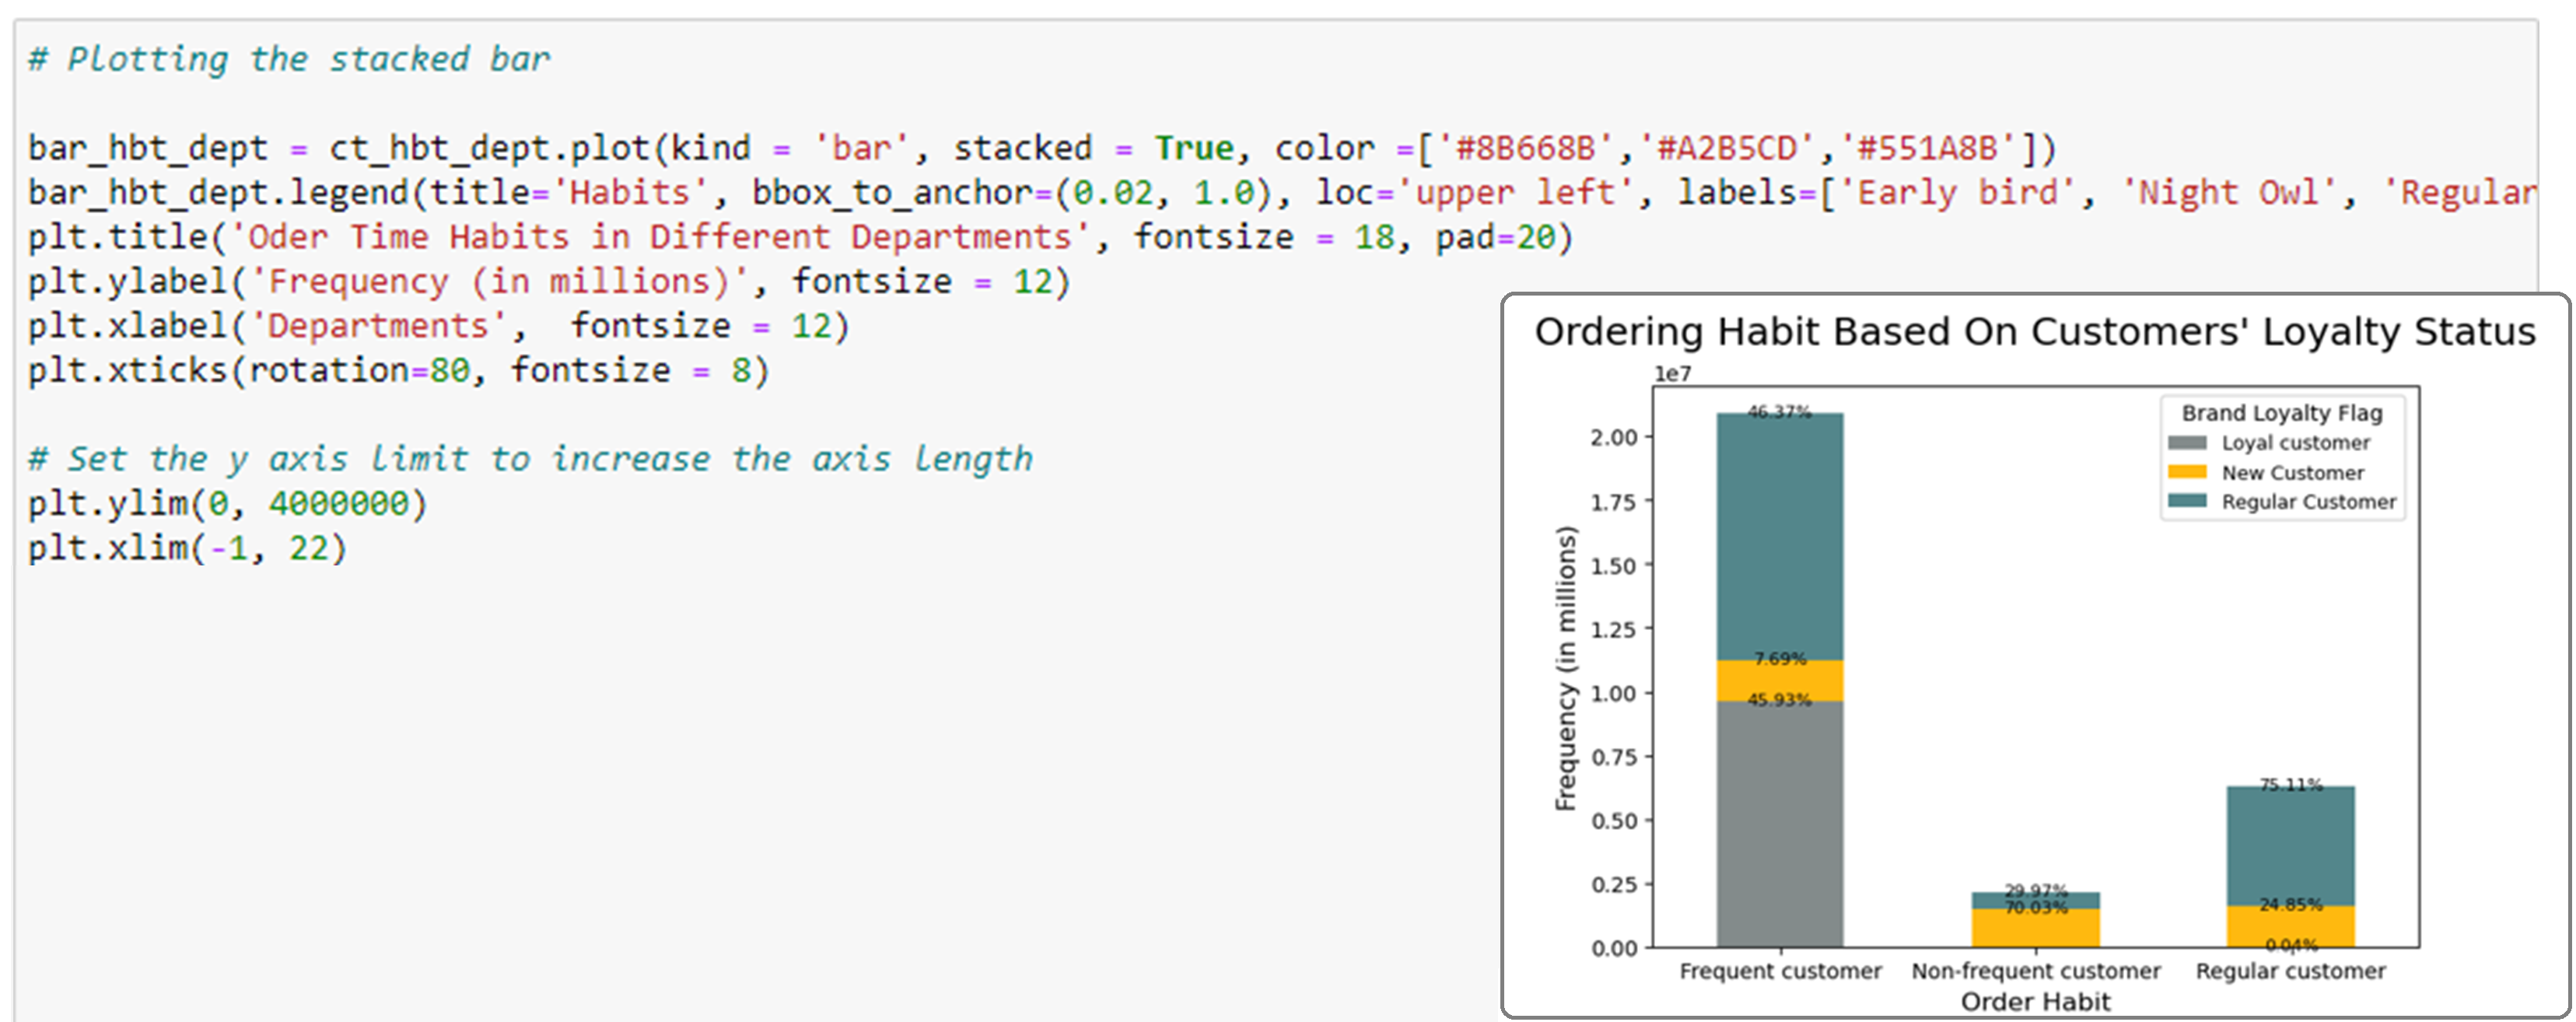
In the right chart (bar) we can see the distribution of orders during the three periods in a day. Early birds place their orders between 5am-8am, regular customers 9am-11pm, and night owls after midnight to 4 am. Over 80% of orders come through regular hours.
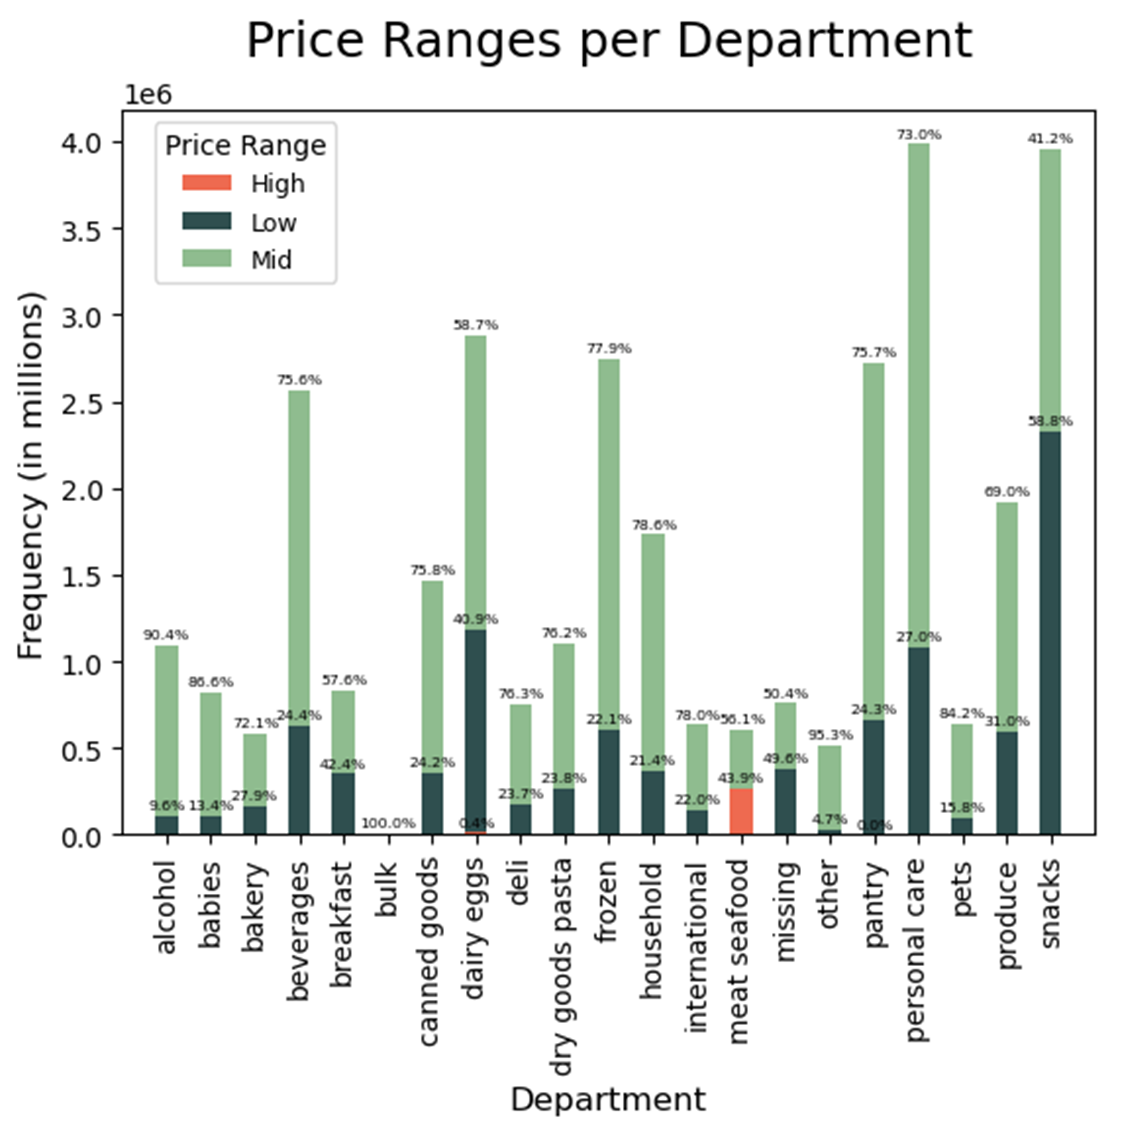
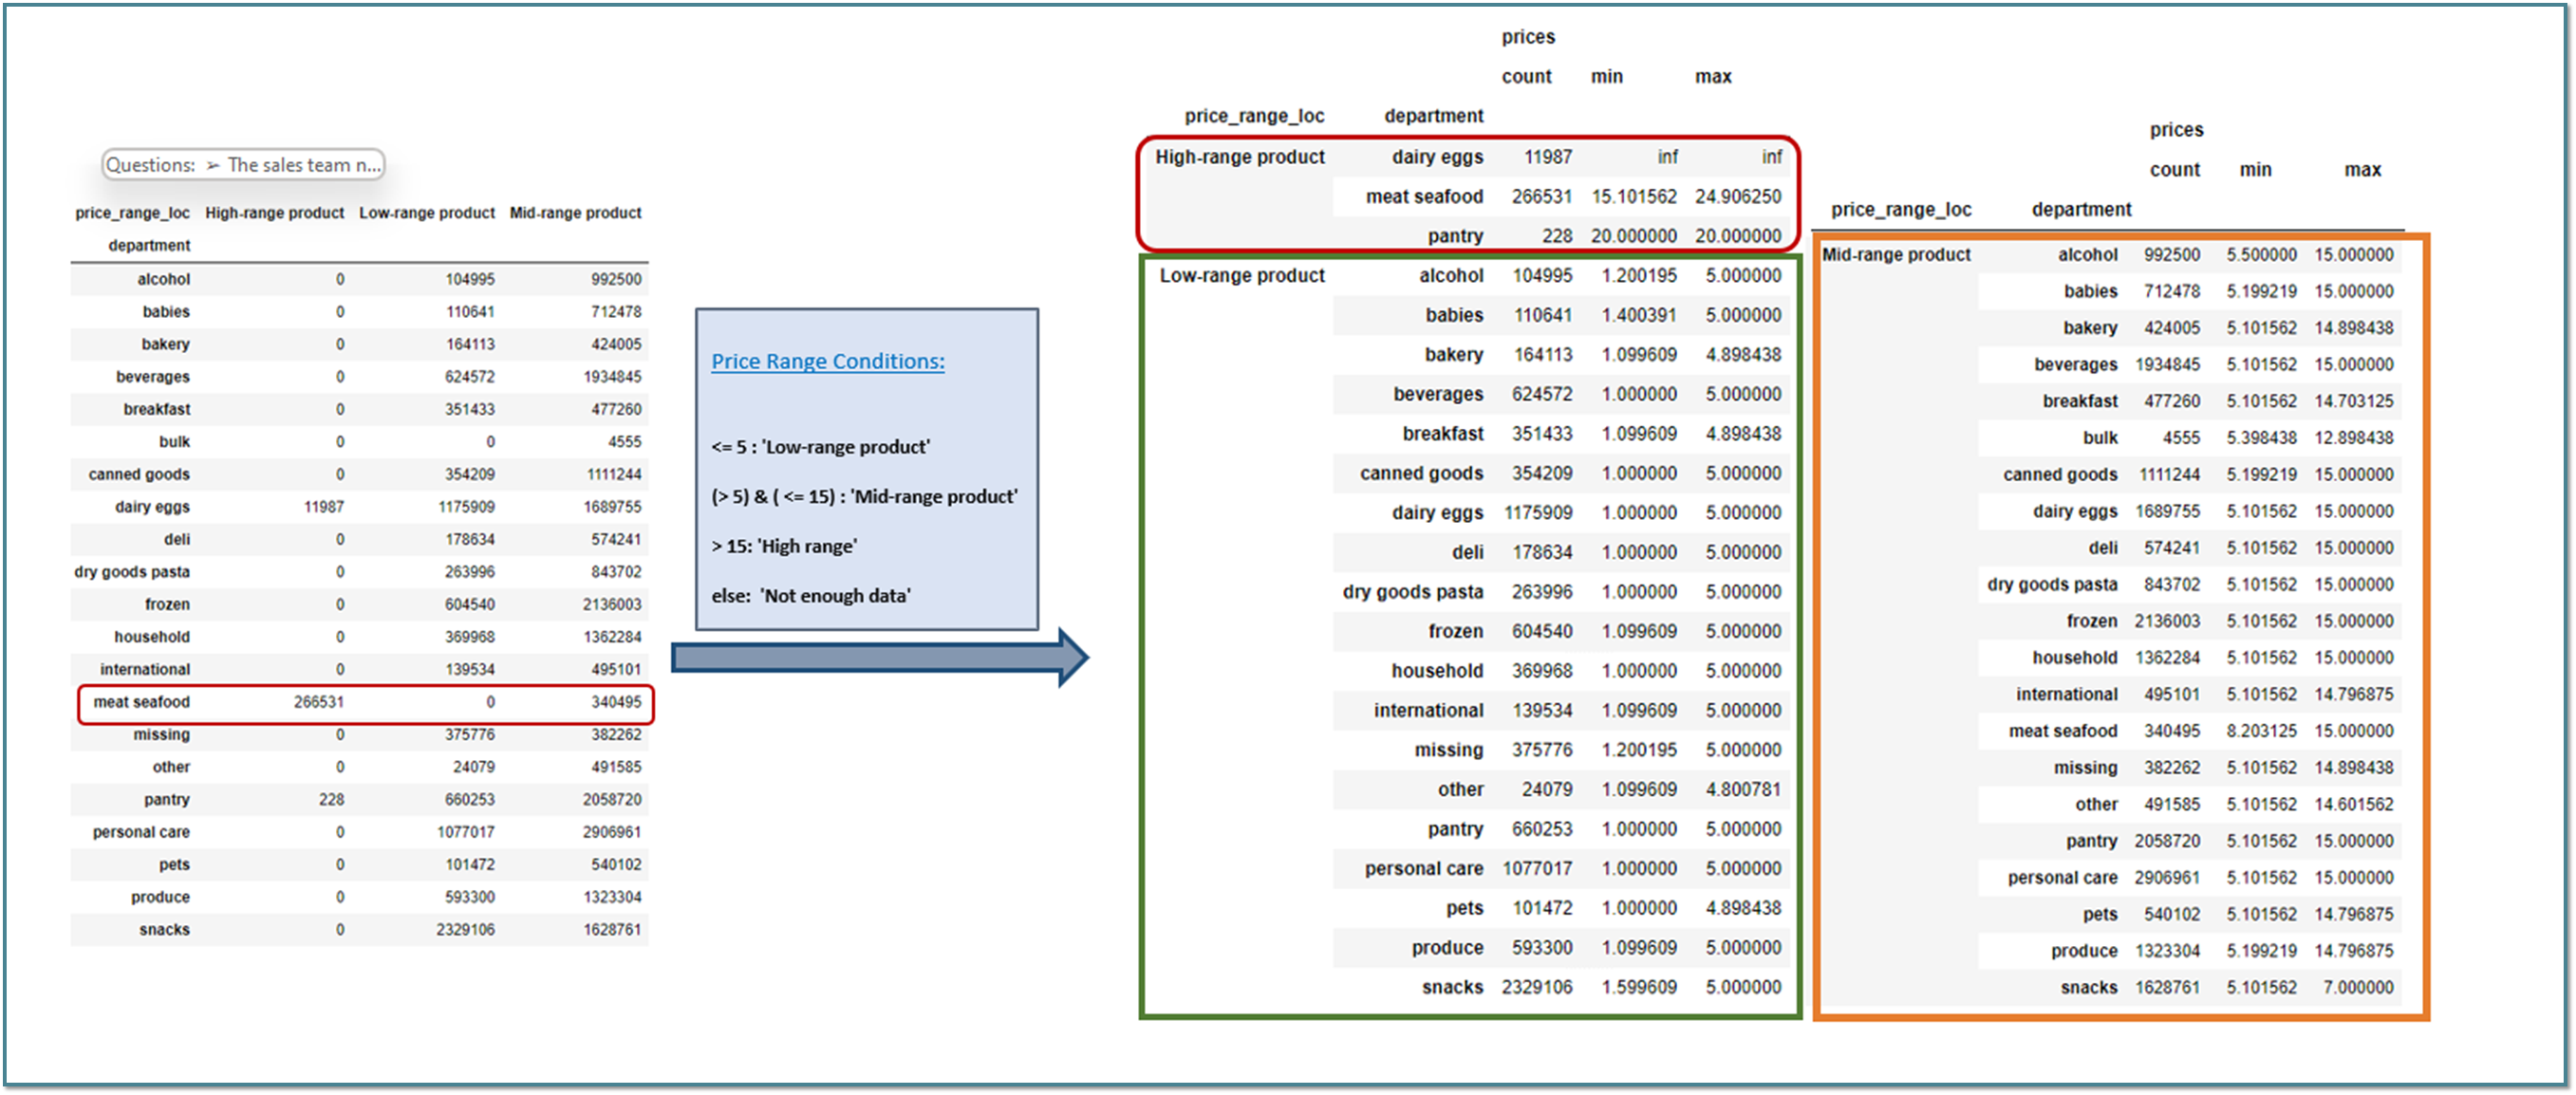
Instacart has a lot of products with different price tags. Marketing and sales want to use simpler price range groupings to help direct their efforts.
Products are organized in three categories: Low/Mid/High-range based on given conditions. To get a detailed conclusion please refer to the crosstab tables and charts explanation below the visualizations.
- Please note that dairy products are not really high- range, and they are categorized as such because of an outlier (2% milk priced at 99,999).
- Please also note that Pantry high-ranged products contribute just less than 0.03% (small proportion of the whole pantry products), so we can not see this category on the stacked bar chart below.
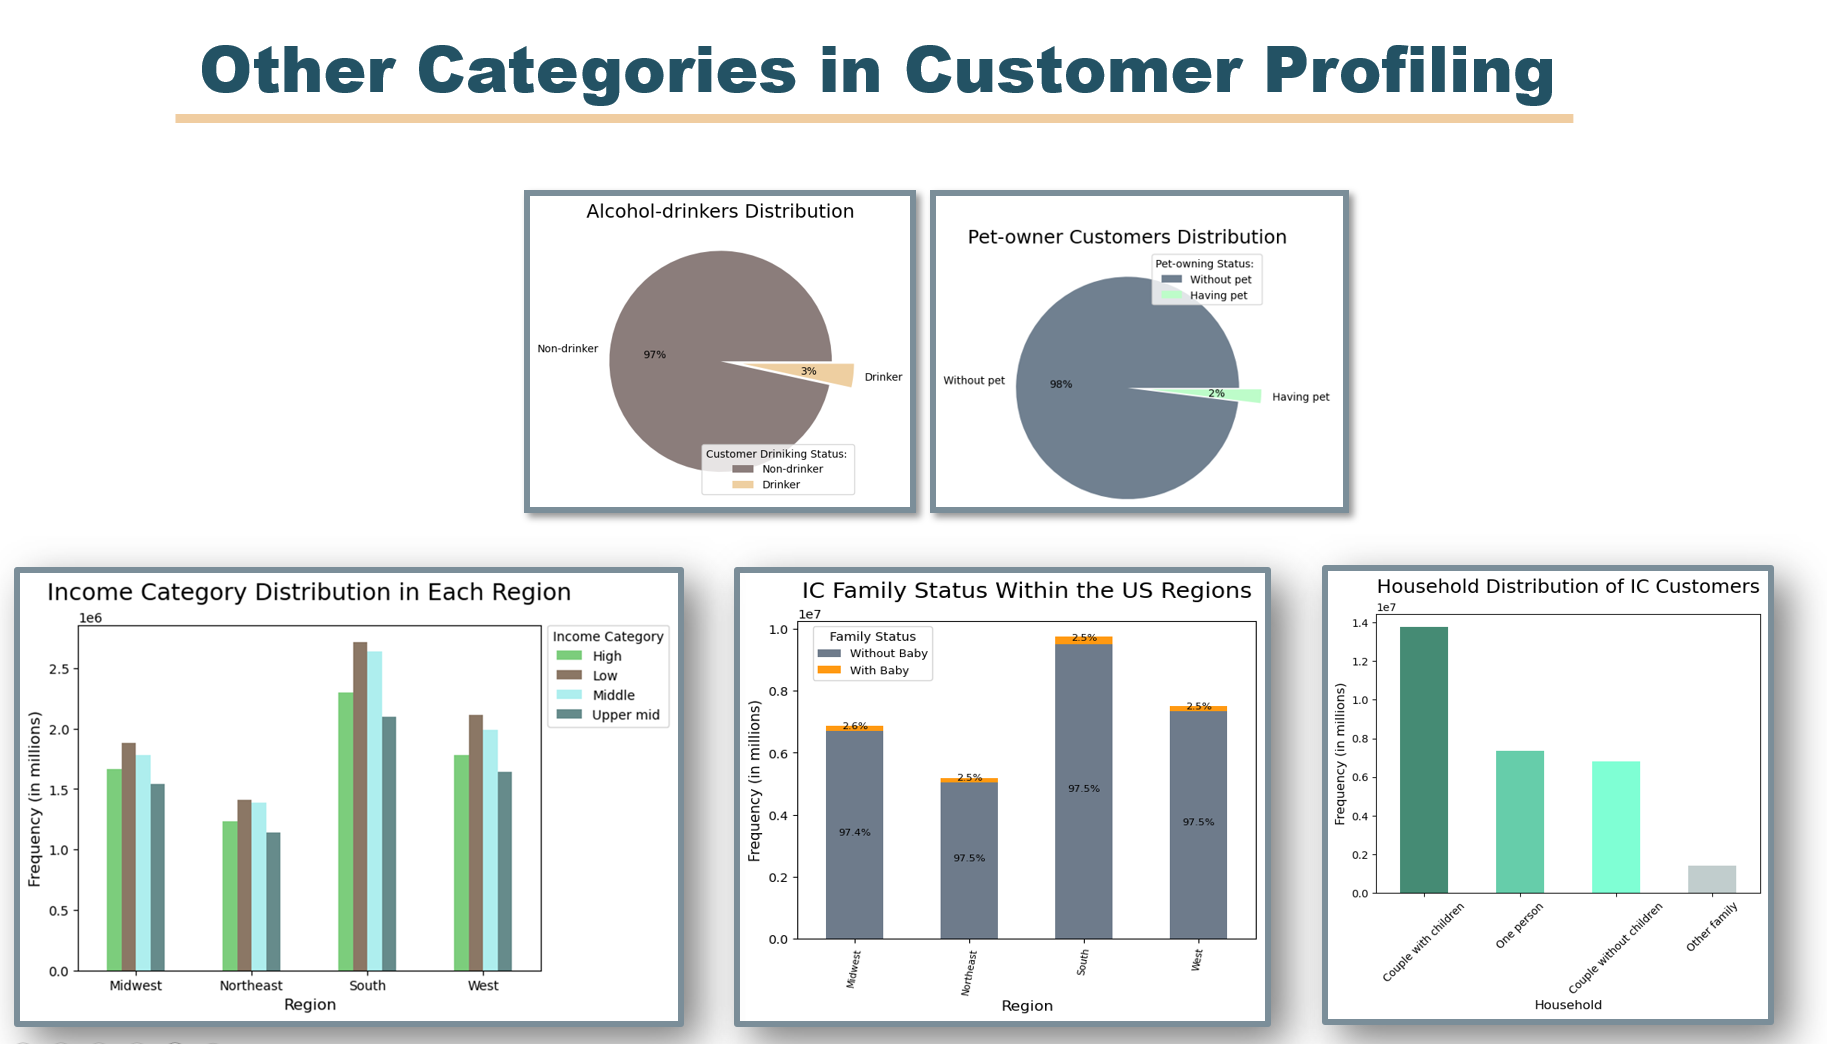
The marketing and sales teams are particularly interested in the different types of customers in their system and how their ordering behaviors differ. For example:
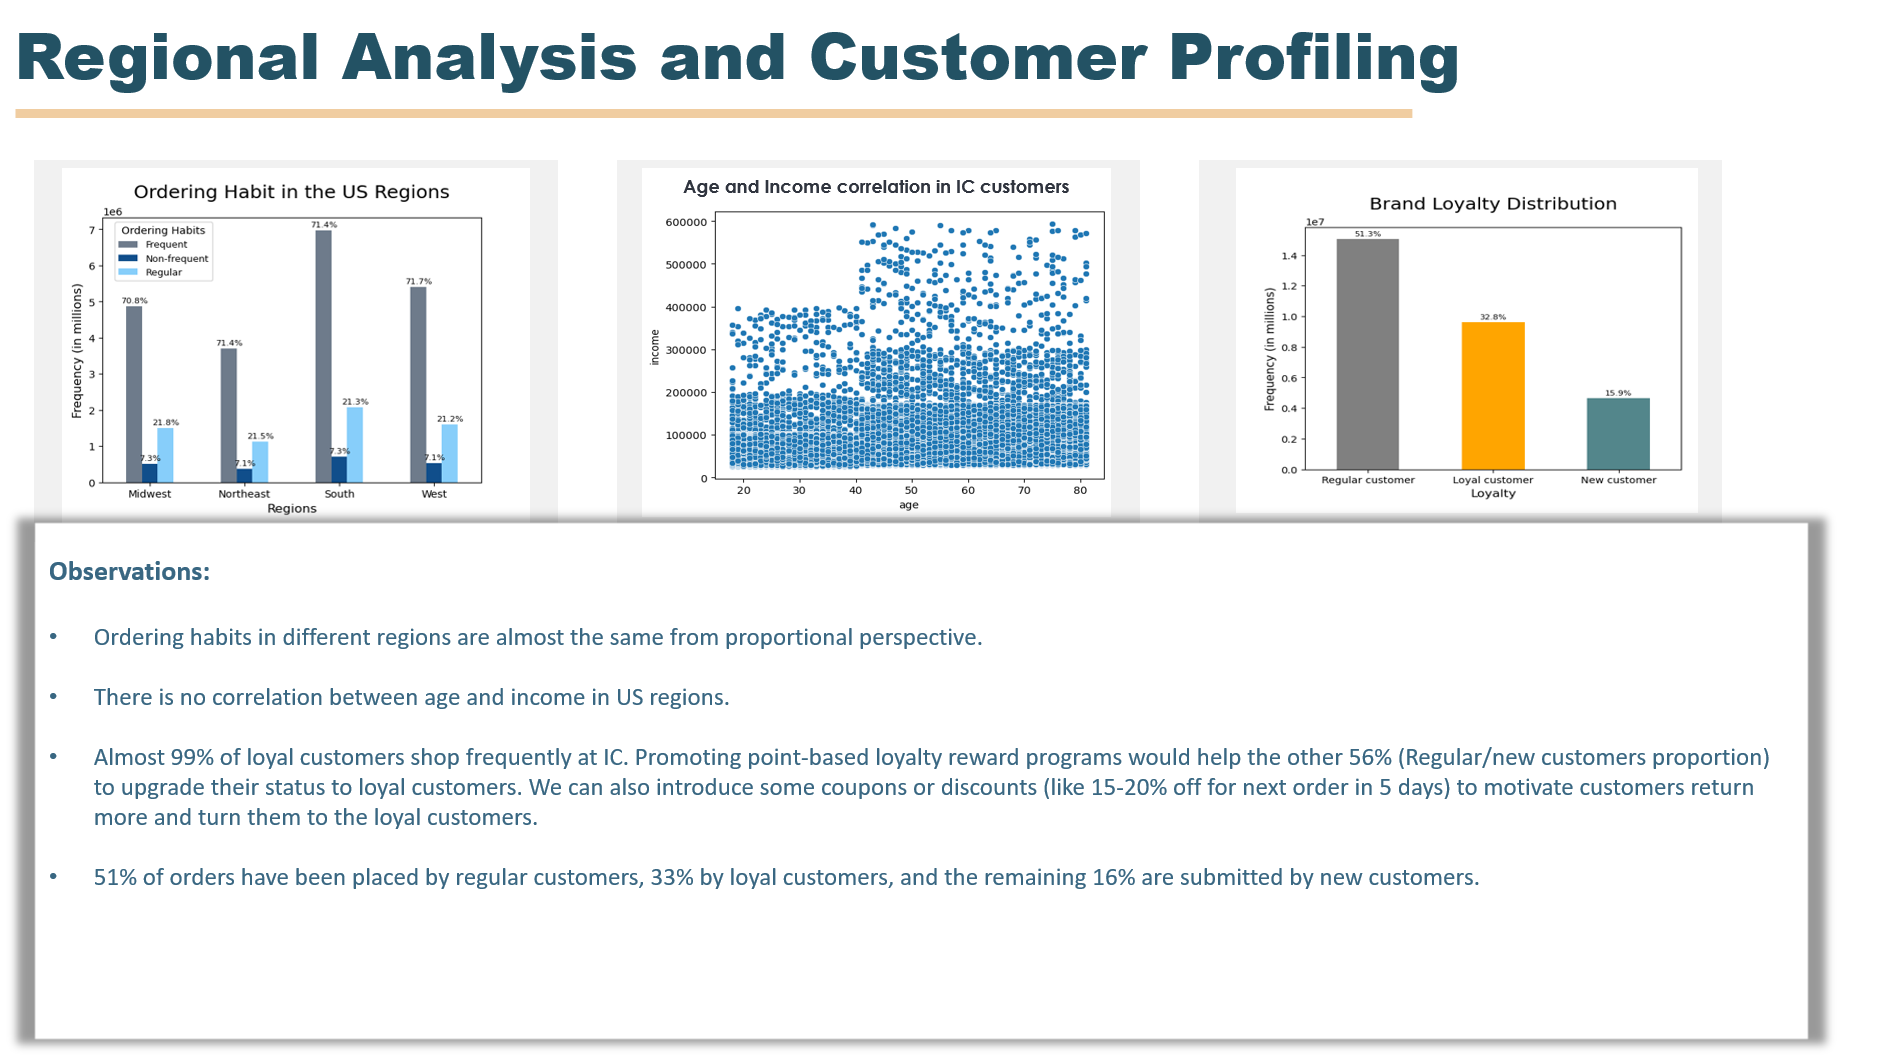
What different classifications does the demographic information suggest? Age? Income? Certain types of goods? Family status?