
- MySQL
- Microsoft Power BI
- Visual Studio Code
- DBeaver

We imported a CSV of open data on Covid-19 pandemic into a MySQL database and ran multiple queries
to extract descriptive statics from it.
We practiced creating temporary tables, views, window functions (PARTITION BY), and more.
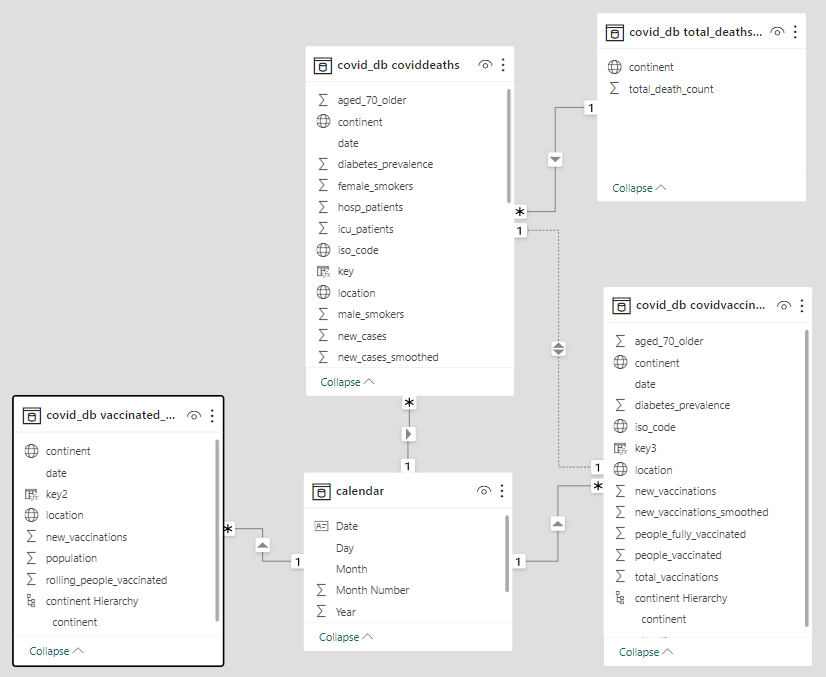
We then used MySQL connector in Microsoft Power BI to create a report and publish it on the web.
Analyzing the data related to the Covid-19 pandemic, including but not limited to vaccinations, casualties, and more.
This is a project that I built as a showcase of Bower BI capabilities.


These three questions are solved by analysis of multiple variables in the dataset.
A Power BI dashboard is used to visualize these variables, so that the data can be filtered and analyzed at the country and continent levels.
A slicer is used to provide the ability to focus on an interval of time.
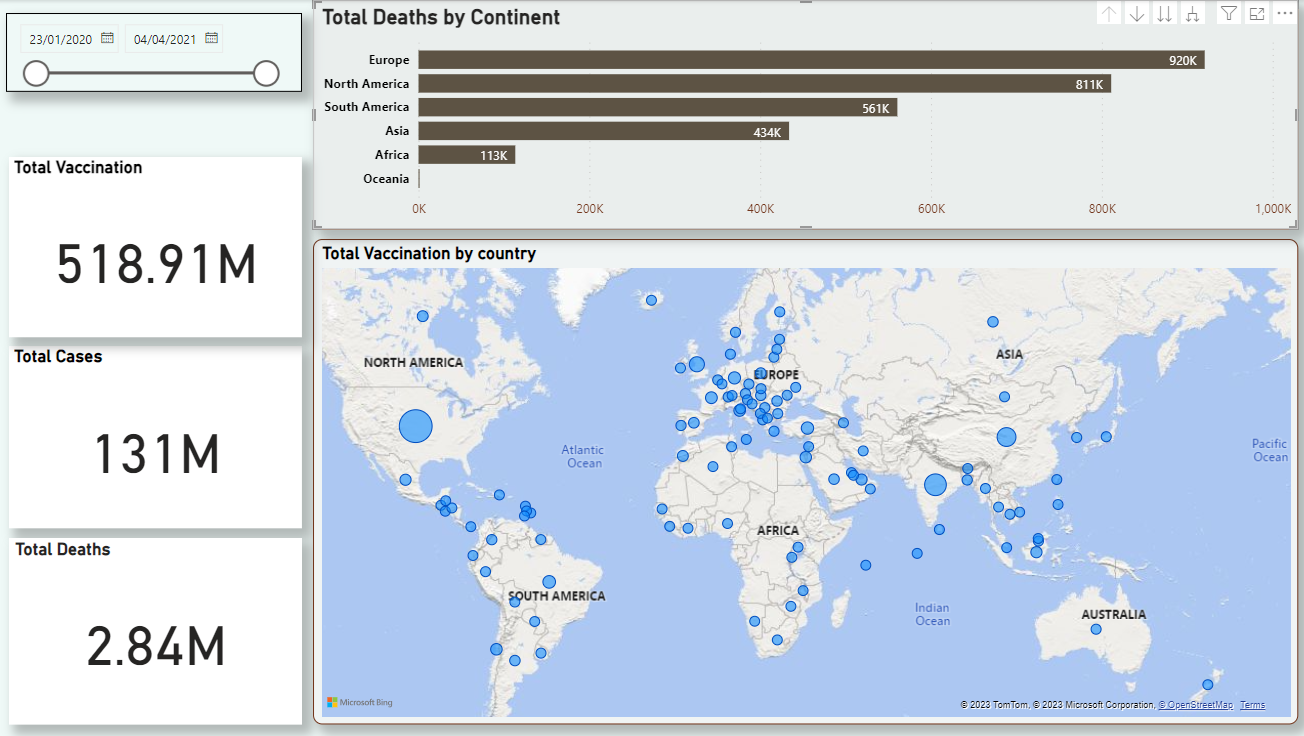
The data shows Europe had most Covid-19 cases in this period (41m cases) followed by North America (35m cases).
The dashboard can be used to visualize vaccination counts per country and per continent. The visualization shows that Asia has most vaccinations (more than 194m) during this time. This can be explained by the fact that India and China are among the top three countries with most vaccinations.
In this period there have been 2.84m deaths reported due to Covid-19 all around the world. Europe with more than 920k deaths has the highest number of deaths.